- +1 800 433 4609
- |
- Request Info
Bioelectrical Impedance Analysis (BIA) and Body Composition Analyse
As a physician, you know that the Body Mass Index (BMI) by itself is no t sufficient to analyze a patient's health status and body composition thoroughly.
Fat, muscle, water and other important indicators of underlying medical conditions are not considered in the BMI.
Reason enough for Medeia to develop exactly that - a new device that measures patients' body compositions - the "BCA" (Body Composition Analyzer). As a component of the QBioscan, it produces all these measurements and values at medical science highest standard levels.
As a result, now a tool exists that, in less than 20 seconds, can determine fat mass, extracellular and intracellular water, and skeletal muscle mass, all fundamental assessment components to aid an accurate patient evaluation. Simple, user friendly, and with medical precision, this device can conveniently be integrated into your examination routine.
In order to make QBioscan the optimal medical Body Composition Analyzer for working conditions in hospitals and medical practices, we looked beyond the many technical requirements and at the advantages and benefits that are valuable and of importance to medical staff and patients. We understood it had to be fast and easy to use and the measurement results had to be reproducible under normal clinical working conditions. That's' how we designed and build QBioscan.
The QBioscan provides physicians and other users with a myriad of diagnostic options. Analytical modules provide accurate ratios for, for example extracellular to intracellular water, or fat mass to weight, and present doctors with indications of medical disorders that would otherwise need additional examinations to be diagnosed. The graphic presentation of the results is another benefit. It provides a summary and overview and helps visualize the data.
Energy
The QBioscan's energy module delivers information about the energy stored in a person's body. It not only calculates the resting energy and total energy expenditure, but besides absolutes, shows also the relative value of fat mass to weight.
* Energy stores in body
* Fat mass (FM/%FM)
* Total energy expenditure (TEE)
* Resting energy expenditure (REE)
Fluid
The Fluid module provides conclusions about the Total Body water, and details extracellular and intracellular water. The patient's fluid status can be presented in form of a graphic by using the Bioelectrical Impedance Vector Analysis (BIVA). Should the proportion of extracellular water be exceptionally high could this be an indication that the patient retains water.
* Total body water (TBW)
* Extracellular water (ECW)
* Hydration (HYD) = Extracellular water/intracellular water
* Bioelectrical Impedance Vector Analysis (BIVA)
Function/Rehabilitation
With the help of the Function/Rehabilitation module, the patient's level of fitness and metabolic activity can be measured and training progress can be followed. Medeia has also developed a Body Composition Chart (BCC) that assists in analyzing the overall body composition. It depicts the measurement points of the fat mass indices over a coordinate system.
* Fat-free mass (FFM)
* Fat mass (FM/%FM)
* Fat mass indices (FFMI/FMI)
* Skeletal muscle mass (SMM)
Health risk
To determine a patient's prognosis for general health, the Health risk module and its phase angle provide conclusions about the condition of body cells and the entire organism and present this evaluation in the BVIA. Plotted in the BCC, this module also evaluates fat mass index (FMI) and fat-free mass index (FFMI).
* Phase angle (f)
* Hydration (HYD) = Extracellular water (ECW)/ intracellular water (ICW)
* Bioelectrical Impedance Vector Analysis (BIVA)
* Fat mass indices (FFMI/FMI)
What Is Body Constitution?
The elements that are necessary to build a human body are referred to as body composition and are separated into two groups: lean body mass and body fat. The former includes muscle, body water, protein and minerals, and the body water is divided into internal cellular and extra cellular water. Cells receive their volume through intra-cellular water and blood, lymph fluid, etc. are the components of extra-cellular water, while the sum of both, intra-cellular water and metabolically active tissues is determined as the body cell mass.
The Essentials
The elements of a human body include protein, water, fat, minerals and other important constituents in a certain ratio to each other. While in healthy people the body composition is balanced, in unhealthy people the balance is unstable. The possibility to analyze and evaluate the balance of body composition is an important step forward in making assessments about the metabolic status, and to use it as an index of obesity and edema & protein-deficient malnutrition. As a basic examining tool for health checkup, the body composition analyzer can be used to prevent and cure disease, by early detection of an imbalance in the body composition.
Configuration Of Body Composition
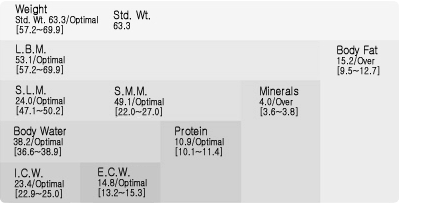
I.C.W. + E.C.W. = Body Water
Body Water + Protein = S.L.M.
S.L.M. + Minerals = L.B.M.
L.B.M. + Body Fat Mass = Body Weight
Lean body mass plus body fat = body weight.
There is a body composition table on the result sheet that rates the findings by comparing the actual body composition and standard body composition, and evaluates them as UNDER/OPTIMAL/OVER. The values for the range of standard body composition are presented in [ ].
History
Bioelectrical Impedance Analysis has a long history and dates back all the way to 1786, when the Italian physicist Galvani experimented with tissue structures in a frog and observed the influence electrical current had on it. As he did not further develop his studies into a more defined format, however, it was not until much later, at around the 1960th that the subject regained new attention.
Thomasset, a French Physician was sure that he could reflect the fluid content of the human body through electrical resistance. As a result, in 1962, he and his colleagues developed one of the first impedance analyzers to measure biological tissues.
Nyboer, an American researcher was finally able to prove that impedance values do actually permit us to draw conclusions about our bodily composition, and around 1970, he laid down what is known today as the foundation of the modern form of impedance analysis. In the 1980's the term bioelectrical impedance analysis was finally established as the name for the method. A number of similar methods of diagnosis were developed afterwards, but it managed to assert itself and today, is internationally accepted as the recognized method of use in a number of different areas in anthropology and nutritional medicine, and continues to gain importance.
Specialists around the world now take the opportunity to regularly meet at the BIA Consensus Conference that takes place at the American National Institute of Health NIH, to share and exchange their experiences, a sign of the continued further development and interest in this subject. The use of impedance analysis is a reliable, simple, and highly cost-effective method, and provides medical practitioners with the opportunity to make differential diagnosis. A broad spectrum of instruments and software for specific areas of application that is developed continuously ensures ever-increasing precision and safety, and forms the basis for objective, long-term approaches to treatment.
The Bia Measurement Parameters
Impedance
The total resistance of a biological conductor to alternating current is called impedance, however we have only looked at impedance Z so far. There are two components that form the impedance:
1. The resistance R, which is a pure (ohms) resistance of the electrolyte-containing total body water, and
2. The reactance Xc, the capacitive resistance, which is present due to the condenser-like properties of the body cells.
By measuring the phase angle, the determination and a differentiation of both of these components of impedance is possible.
Phase angle
Modern BIA devices have phase sensitive electronics that enable you to take the measured total resistance and differentiate between the two components resistance and reactance.
The measurement's formula is built on the knowledge that the condensers in the alternating current circuit lead to a time delay t, meaning the current maximum is ahead in time of the voltage maximum. In the body, each metabolically active cell has an electrical potential difference of about 50-100 mV at the cell membrane, and this potential permits the cell to act like a spherical condenser in an alternating electrical field. Alternating current has a sinus wave, therefore the shift is measured in ° (degrees) and is described as a phase angle f (phi) or a (alpha).
To explain it in a more visual way - You will see a large phase angle for well nourished, "plump" cells with stabile membrane potentials, and comparable small phase angles with poorly nourished, "failing" cells that have low membrane potentials.
The phase angle, which is directly proportional to the BCM or body cell mass is of greatest significance at a 50 kHz frequency. Pure electrolyte water has a phase angle of 0 degrees, while a genuine cell membrane mass would have a phase angle of 90 degrees. Contrary to the cells of the BCM, fat cells have hardly any metabolic activity and cannot be detected by phase sensitive measurements because of their minimal membrane potential. Fat cells are pure storage cells.
The phase angle is used as a general measure of the membrane integrity of the cells. It provides information about the state of a cell and the overall condition of a patient's body, and as direct measurement parameter or "basic value", it is less prone to errors resulting from problems affected by measuring technology.
Multi-frequency measurements
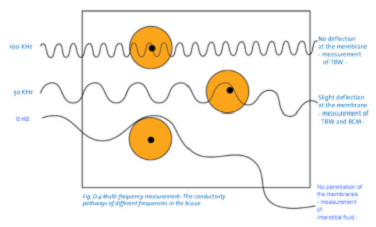
Frequency plays an important role in the resistance of a biological conductor, as for example very low ranging frequencies (in the range 1 to 5 kHz (Kilo Hertz)) have difficulties overcoming the cell membranes, and are therefore only able to reproduce in the extra-cellular mass, which means they practically hold no reactance component. That's why, to be able to calculate the extra-cellular water (ECW), there are multiple frequencies that can be used. As the frequency increases, so does the phase angle and with it the capacitive resistance (reactance). The maximum frequency is reached at about 50 kHz. Higher frequencies will cause both, the resistance and the reactance to decrease again. Cole defined this relationship between frequencies and resistances in 1968, and the graphical representation of the correlation between resistance and reactance at different frequencies is called a Coleplot.
The use of multi-frequency analysis provides an improved differentiation with regard to cell loss or water displacement, by assessing variations in mass of the extra-cellular mass ECM and the body cell mass BCM.
This process is especially beneficial in patients with a changed grade of hydration in the lean body mass, and patients with serious illness such as kidney or heart failure, or patients with edema and diseases that require the crucial monitoring of water balance (dialysis, intravenous nutrition). This multi-frequency analysis has many advantages.
Resistance
Inversely proportional to total body water, Resistance R is the pure resistance of a conductor to alternating current. Whereas fat mass has a raised resistance, lean body mass is a good conductor of electrical current, as proportionally it entails high amounts of water and electrolytes.
In healthy, normal weight individuals, the resistance is an excellent measure to calculate the body water, which originates to about 95% in the extremities. Perfusion and fluid content of the extremities therefore play an important role and explain the occasionally occurring over-proportional variations in resistance. They arise because of the influence of external conditions, such as ambient temperature and air-pressure, as well as internal factors such as for example congestion caused by illness and physical activity. All of these conditions affect the water content of the extremities. This may also happen with very low water content of the extremities (caused by high pressure or coldness). The resistance measurement will be very much above the normal range with the result of this calculation method. The body water and therefore the lean body mass will tend to be too low and the body fat will be calculated as too high.
In another scenario, if the circulation in the extremities is increased or congested, the resistance shifts downwards. Body water and lean body mass appear too large, and calculations of the body fat will appear as too low in the results.
It is important to remember that the human body is never static, but functions with the help of a dynamic system, and that changes of the body water occur hourly and change on a daily basis. A current B.I.A. can therefore only be a snapshot of a dynamic system and of the condition at that point in time. That's why several repeat and response measurements of the individual will provide a more accurate picture and improve the assessment of body composition.
Reactance
The resistance that a condenser exerts to an alternating current is called Reactance Xc. Due to their protein-lipid layers, all cell membranes of the body act like mini-condensers and reactance therefore is an assessment of the body cell mass.
General Principles
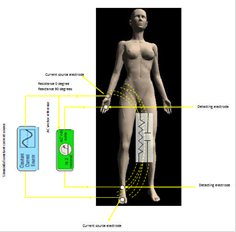
Bioelectric impedance measurements (BIM) is the term representative for a variety of traditional and new noninvasive procedures and technologies that use electric current. With the help of one or more surface electrodes, a tiny amount of electrical current is activated and is detected at surface electrodes placed elsewhere on the body, once the resultant electricity pulse has passed through.
As it quickly proceeds through the various physiological sections of the body, and passes through, a drop in voltage occurs. The current encounters impedance or resistance inherent in the fluids and tissues it passes through the various areas, among them the intracellular space, the lymphatic system, the bloodstream and others. The drop in voltage delivers indirect information about the physical properties of the sections, where current has passed through.
Alternating Current Bioelectric Impedance Analysis (BIA):
Among the various number of A.C. BIA models that are presently on the market, most are used for the obliquely measurement of total body water and to estimate the fat content of the body. BIA, which uses alternating current (A.C.) as the most common form of testing, employs A.C. electricity. Various systems, varying broadly in complexity and design, operate with a wide range of intensities, frequencies and currents. For the patient, the amount of electricity delivered to the body is generally hard to even detect and far below any level that would result in cellular or tissue damage. Once electric currents at or above 50 KHz are used, they flow non-selectively through extra cellular spaces as well as intracellular ones, as has been confirmed by various A.C. BIA studies.
Once current has been sent to active tactile electrodes at a frequency at 50 KHz, its intensity enables the system to measure the reactance and resistance between 2 other passive tactile electrodes (tetra-polar mode).
BIA and Its Calculated Parameters
Total Body Water (TBW)
Impedance measurements provide a quite accurate picture of electrolyte water contained in tissue. Orally ingested water, which has not yet been absorbed by the body, is not measured; the same goes for ascites, because it is not part of the lean body mass. Administered solutions, however, are detected immediately.
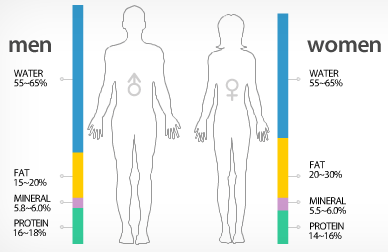
Normal value range - males: 50 - 60 %
Normal value range - females: 55 - 65 %
Highly muscular: 70 - 80 %
Obese: 45 - 50 %
Distribution of TBW
Extra-cellular: 43 % of TBW (transcellular, interstitial, lymph,plasma)
Intra-cellular: 57 % of TBW
To measure an individual's body water, the BCM body cell mass needs to be analyzed, which is mainly present in the muscle mass. Underlying conditions for the detection of deposited water can be a raised ECM/BCM index, and a lowered percentage of cell fractions could also be an indication of water accumulation.
Lean Body Mass (LBM)
The lean body mass is for the most part made up of inner organs, muscles, the skeletal system and the central nervous system, and refers to the tissue mass of the body that contains no fat. These organ systems, although morphologically very different, contain matching functional structures.
All of them contain matrix substance and extra-cellular fluids that support the metabolic exchange and assist in substrate transport and are made of cells that execute the synthesis and metabolism processes in the body.
What is defined as the lean body mass contains 73% of water according to Pace and Rathburn (1945), and therefore, deriving lean body mass from body water, the calculation looks as follows:
LBM = TBW/0.73
This formula is based on the assumption that there is regular and constant hydration value for the lean body mass, and an equal population that is healthy. The percentage of water in children, however is higher and water measurements for special conditions have also shown very different values: For example in cases of anasarca, water content has been at 85% and therefore a higher level, and in exsiccosis for example, it is lower: 67% (Shizgal 1981).
In cases of for example edema or intensive car patients, where the quantity of lean body mass hydration is pathological, irregular calculations may be gathered for body cell mass, lean body mass, and extra-cellular mass - the secondary parameters - and will make the assessment of BIA measurements more difficult. It helps in these cases, to look at the initial assessment and values for resistance, phase angle and reactance.
The lean body mass contains of two subdivisions. One is the body cell mass BCM, also referred to as the motor of the organism, and the other one is the connective tissues and transport medium, the extra-cellular mass ECM.
Body Cell Mass (BCM)
All tissue of the human organism entails to a certain degree Body cell mass, and the sum of all cells that are actively involved in the metabolic processes is called BCM. While it is rather a functionally defined section and not so much an anatomically one above all, it consists all of the cells of the inner organs and muscles, with the muscles and the highest percentage to constitute the largest part of the BCM. Connective tissue with low fibrocyte content however only makes up a small percentage of the entire BCM, and adipocytes, due to their low energy metabolism are not at all considered being part of the BCM. Consequently, the sum of adipocyte cells therefore forms its own compartment in the body.
Included in the BCM are the following tissue forms: the smooth muscles, the cells of the skeletal muscle system, the inner organs, the cardiac muscles, the blood, the gastrointestinal tract, the nervous systems and the glands.
As all of the body's metabolic function is performed within the cells of the BCM, the BCM is the main specification for the analysis of a patient's nutritional state. It is also used as the standard specification for establishing the calorific requirement of the body and for the assessment of energy consumption.
In addition to the catabolism, the BCM also performs work on the anabolism including the keeping up of synthesis and cell structures for the ECM: For example the transportation proteins and enzymes, and the formation of connective tissue fibres, cartilage tissues and bones.
A person's body cell mass is a fractional constituent of the lean body mass, and a number of factors, such as age and physical condition or genetics (constitution type) play a role in the BCM that is available in an individual.
A higher percentage of body cell mass present in lean body mass is for example found in young people with high physical activity, such as competitive athletes. Their muscles are trained in the maturation phase of the body, and as a result, this higher proportion tends to be found in these individuals throughout their lives (persistent hypertrophy of the muscle cells). In competitive athletes, the BCM can amount to up to 60 % of the lean body mass. Age is also a factor in BCM. In children and young people for example, the proportion of the cell mass in the lean body, as it is not fully developed yet, is less than 50%. Following the completion of longitudinal growth, the muscle cells finally differentiate, and in adults with an average normal nutritional status more than 50% BCM is present in the lean body mass. This changes once again with the aging process, when the BCM tends to decrease due to less physical activity or even inactivity, and settles quite often around 45 - 40%. Older persons that are active, however, can retain their BCM to a large degree.
What is defined as normal for the proportional body cell mass in lean body mass are values in the range of 53 - 59% for men in the age group of 18 - 75 years, and 50 - 56% for women. These are optimal figures for BCM in the lean body mass. In view of the easy measuring methods for the assessment of the body composition, only phase sensitive BIA can be regarded to determine the BCM, and the maintenance of the BCM should be the main goal in any form of nutritional therapy.
It should be kept in mind that, even in diets, the BCM loss - if it is at all necessary - should under no circumstances be higher than 20% of the BCM, as the body compensates much more slowly for a BCM reduction, than it would do for example for a reduction in body fat. A reduction of the body cell mass in BIA happens because of a genuine substantial loss of body cell mass, that can however also be accompanied by a temporary intracellular water loss.
That's why a genuine loss of BCM is only experienced once the phase angle goes down, and at the same time the cell density falls in % and reactance drops.
Extra-Cellular Mass (ECM)
The extra-cellular mass (ECM) is the term for the lean body mass that exists outside the cells of the BCM.
Skin, elastin, collagen, tendons, bone and fasciae are the established connective tissue structures of the ECM, with the fluid parts consisting of plasma, interstitial and trans-cellular water. Trans-cellular water is the description of fluids that are present in the body cavities, for example the contents of the gastro-intestinal lumen and the spinal fluid, while non-physiological trans-cellular fluids appear as ascites, or as pericardial or pleural effusions.
As approx. 95% of the electrical resistance is measured in the extremities and the trunk only contributes approx 5% to the total resistance of body water, trans-cellular water cannot be detected by BIA measurements.
For example in an ascites of 5 litres, the trunk's resistance would only change by a few ohms, leaving the total resistance practically uninfluenced. Differences in fat mass that were brought about by weight changes generally appear without a change of resistance, hence the reason why BIA measurements are calculated as changes in fat mass, when it pertains to weight increases caused by ascites or pregnancy.
ECM/BCM Index
The second most important parameter for the assessment of nutritional condition is the ECM/BCM. As the body cell mass BCM in healthy persons is always considerably larger than the extra-cellular mass ECM, resulting in an index that is smaller than 1.
An increase in the ECM/BC index is an early sign of a nutritional status that has been affected and is declining. A decrease of BCM points to early stages of malnutrition. It is accompanied by an increase of extra-cellular mass, while weight and lean body mass remain constant.
There are 3 reasons for a rising ECM/BCM index:
a. Catabolism of the BCM:
A reduction of body cell mass is what usually follows catabolic changes of all origins. In order to keep the total body water constant, the body then compensates by storing water in the extra-cellular mass.
b. Hyperinsulinism caused water deposition in the ECM:
Sodium and water retention begin in the extra-cellular mass in cases of chronic hyperinsulinism and the metabolic syndrome.
c. Other reason for water deposition in the ECM:
Even without changes in weight, water depositions in the ECM are possible, for example in catabolic processes in the BCM or in cases of concomitant water loss. The most sensitive parameter in these cases is then the ECM/BCM index.
Body Fat (BF)
Body fat performs as an insulator to alternating current. With a density of 0.9 g/cm3, and with scarcely any of the typical properties of the cells of the body cell mass (BCM), it barely has any capacitive resistance (reactance). The difference between body weight and lean body mass is calculated as the fat mass.
(%)-Cellular Fraction
The lean body mass is the term that defines in its entirety ECM and BCM, which are both, functionally, quantitatively and morphologically, closely related.
The BCM cell percentage of the lean body mass is unit of measurement that evaluates a body's physical and nutritional condition. Called cell percentage, it is a good qualifier of the lean body mass in an individual.
Normal cell percentage range for men: 53% - 59%
Normal cell percentage range for women: 50% - 56%.
This percentage is lower in cases of extra-cellular hyperhydration or malnutrition. Cell percentages below these guideline values and without a visible edema, are an indicator for malnutrition. They are also lower in patients with genetic diseases that are accompanied by muscular dystrophy.
For the assessment of the stage of malnutrition, reduced cell percentage provides important clues.
The human organism activates intracellular protein to glucohomeostasis and creates sugar from this source, once it takes in food or once there are nutritional deficiencies. While he intracellular loss of protein leads to a reduction of the cell mass, the extra-cellular domain increases in size at the same time. This is caused due to the release of protein-bound intra-cellular water, and in such a situation, the BCM and ECM mass reacts in the reverse way and causes the cell percentage to plummet disproportionately.
On the other hand, athletic training or physical training over a period of many years will result in a high cell percentage.
The same goes for people with a high degree of physical activity - the cell percentage increases. Practicing sport at an early age has a long-lasting effect, as the cell percentage measurement will be high as long as the person lives, even after inactivity has set in. Recreational sports that were only started in adult life have practically no effect on the increase of the cell percentage, and the percentage also only increases very slowly in the case of professional athletic training.
The Coordinate System and Tolerance Ellipses
Bioelectric Impedance Vector Analysis (BIVA) is a graphic display that was developed by Professor A. Piccoli for a better interpretation of body impedance. It presents coordinate systems with tolerance ellipses for the graphic display of body impedance and fat-mass indices. QBioscan presents this principle on the display and uses it in addition to the traditional display of evaluation modules in numerical values, percentile curves and bar graphs. In addition, Medeai's latest device development also includes the interpretation of the fat mass indices.
Biolelectric Impedance Analysis (BIVA)
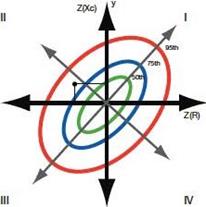
The BIVA, as outlined by Professor A. Piccoli, is a graphical demonstration of the body's electrical resistances, displaying the patient's impedance as a measurement point in a coordinate system:
Ohmic resistance (R) on the X axis, Capacitive resistance (Xc) on the ordinate
R and Xc are both sizes that are considered relative to body size (length of the electrical conductor).
The examination of a proband, using this vector graphic, allows for a simultaneous analysis of his/her body cell mass- Xc, and his/her total body water - R. Differences on the Y axis signify an increase or decrease in the body cell mass, while changes to the measurement point (R, Xc) parallel to the X axis indicate changes to the fluid volume.
The quadrants in the coordinate system are specified accordingly:
* I: Xc high, R high = lower proportion of water
* II: Xc low, R high = higher proportion of cells
* III: Xc low, R low = lower proportion of cells
* IV: Xc high, R low = higher proportion of water
The comparison of an individual measured value with reference values is a further advantage of the BIVA.
Tolerance ellipses are the 50%, 75%, and 95% percentiles that are entered into the coordinate system.
Fat Mass Indices (FFMI and FMI)
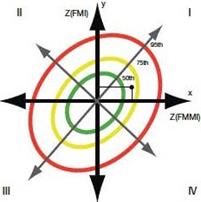
Professor A. Piccoli's system can also be applied to the visual communication of the fat-mass indices. Based on the work of Schutz et al, the correlation of FFMI and FMI is illustrated in four typical situations:
The quadrants in the coordinate system are specified accordingly:
* I: FFMI high, FMI high= high muscle mass
* II: IFFMI Iow, FMI high = obesity
* III: FFMI Iow, FMI Iow = chronic energy deficiency
* IV: FFMI high, FMI Iow = low muscle mass
The FFMI (X axis) and the FMI (ordinate), in addition, are also displayed up on the axes of the coordinate system for FFMI and FMI. Tolerance ellipses are the 50%, 75%, and 95% percentiles that are entered into the coordinate system.
KEY_Web_Disclaimer
